Top 12 ITSM Metrics & KPIs: The Pillars of Successful IT Service Management
IT Service Management (ITSM) is no longer confined to simple service delivery. It’s a robust framework that defines how IT teams align with business needs. A pivotal aspect of this alignment lies in understanding ITSM Metrics & KPIs (Key Performance Indicators). These tools provide tangible insights into IT services’ performance, efficiency, and alignment with overall business goals.
But how can one assess whether IT aligns with business strategy and operates effectively? Understanding ITSM Metrics & KPIs (Key Performance Indicators) is the answer.
ITSM Metrics & KPIs provide tangible insights into IT services’ performance, efficiency, and alignment with overall business objectives. These metrics are not merely numerical values; they tell a story about IT service delivery’s health, agility, and effectiveness.
What Are ITSM Metrics & KPIs?
ITSM Metrics are quantitative measures that assess various aspects of IT service delivery. They offer a detailed view of performance and enable continuous improvement. Conversely, KPIs are specific metrics that directly link to organizational goals and strategic objectives.
Why Are They Important?
ITSM Metrics & KPIs act as vital signposts. They reveal the quality, efficiency, and effectiveness of IT service management. By focusing on operational metrics and strategic KPIs, IT teams can align their efforts with overall organizational objectives, ensuring cohesive growth.
Read more: Key Processes that Drive Effective IT Service Management
Key ITSM Metrics & KPIs
First Call Resolution (FCR)
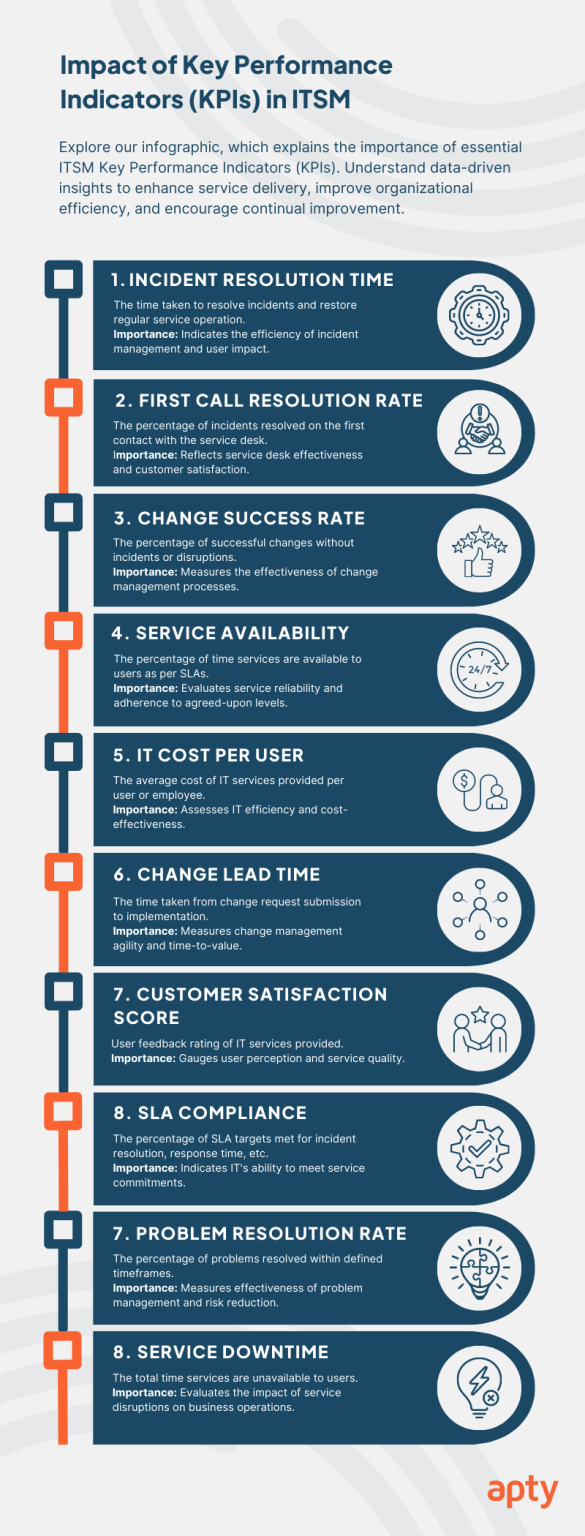
FCR measures the percentage of incidents resolved during the initial contact with support. A higher FCR indicates efficiency in resolving issues quickly. First Call Resolution industry standard for a good FCR rate is 70% to 79%
FCR is a critical KPI in customer satisfaction and operational efficiency. It captures the ability of the support team to understand and address problems without escalation. A high FCR rate often reduces support costs and enhances user satisfaction. Continuously monitoring and optimizing FCR can significantly improve overall service quality.
DAP TIP: A DAP offers guided workflows and context-sensitive help, enabling support staff to quickly diagnose and resolve issues on the first call. This boosts efficiency and contributes to higher FCR rates.
Mean Time to Repair (MTTR)
MTTR calculates the average time to repair a failed service or component.
MTTR considers the repair time and the diagnostic and recovery stages. A lower MTTR reflects higher efficiency in restoring services, minimizing downtime, and thus reducing the impact on business operations. Analyzing MTTR helps understand bottlenecks and areas where process improvements or additional resources are needed.
DAP TIP: With DAP’s analytics and automation capabilities, IT teams can pinpoint problem areas faster, reducing the repair time required and effectively lowering MTTR.
Customer Satisfaction (CSAT)
CSAT gauges customer contentment with the services provided. CSAT is typically measured through surveys and feedback forms, capturing the perceived quality and satisfaction of the service. U.S. companies lose more than $62 billion annually due to poor customer service.
High CSAT scores reflect positive customer experiences, while low scores indicate underlying issues requiring attention. Regular CSAT assessment helps organizations keep a pulse on customer sentiment, allowing timely interventions.
DAP TIP: DAP enhances user experience through personalized support and intuitive guidance, improving customer satisfaction scores and positive feedback.
Incident Volume
This metric quantifies the number of reported incidents within a specified timeframe.
Incident volume helps identify trends, recurrent problems, and potential IT systems or processes weaknesses. Analyzing patterns and correlations between incident types and other factors can lead to preemptive measures, reducing future incident volumes and enhancing system reliability.
DAP TIP: A DAP can prevent many common user errors by providing contextual in-app guidance and proactive support, thus reducing overall incident volume.
Service Request Volume
Service Request Volume reflects the number of service requests made by users.
Understanding service request volume helps in resource planning, demand forecasting, and identifying opportunities for automation. A high volume of particular requests might signal the need for improved self-service options or additional training and support.
DAP Tip: DAPs facilitate self-service through interactive guides, decreasing the need for service requests and enabling users to complete tasks independently.
Availability
Availability measures the time service is operational and accessible.
Availability is essential for trust and reliability in IT services. It’s often linked with SLAs and is vital in industries where continuous service is mandatory. Constant availability monitoring ensures that downtime is minimized and any disruptions are addressed proactively.
DAP TIP: Through continuous monitoring and automated responses, a DAP can detect potential disruptions early and take corrective actions to ensure optimal service availability.

Service Level Agreement (SLA) Adherence
SLA Adherence evaluates how well services meet the contractual obligations laid out in SLAs.
SLA Adherence is directly tied to customer satisfaction and trust. Failure to meet SLAs can result in penalties and tarnish the service provider’s reputation. Monitoring SLA adherence ensures alignment with customer expectations and helps maintain a positive relationship with stakeholders.
DAP TIP: DAP’s tracking and analytics ensure that SLA metrics are consistently met by monitoring performance against benchmarks and alerting when deviations occur.
Change the Success Rate
The percentage of successful changes without incidents or disruptions.
Change Success Rate measures how many changes are implemented successfully without causing subsequent incidents or disruptions. High success rates indicate an effective change management process, reducing risks and enhancing stability.
DAP Tip: DAPs can guide and streamline change processes with automation, ensuring that every step is followed correctly. This reduces errors and contributes to a higher Change Success Rate.
IT Cost per User
The average cost of IT services provided per user or employee.
IT Cost per User assesses the efficiency and cost-effectiveness of delivering IT services. Monitoring this metric helps identify areas for cost reduction and resource optimization.
DAP Tip: Through automation and self-service options, DAPs can reduce manual interventions, lowering the IT Cost per User and achieving greater efficiency.
Change Lead Time
The time is taken from change request submission to implementation.
Change Lead Time measures the agility of the change management process. A shorter lead time reflects a more responsive and agile process, adding value to the business more quickly.
DAP Tip: DAPs can automate various stages of the change request process, reducing delays and reducing Change Lead Time.
Problem Resolution Rate
The percentage of problems resolved within defined timeframes.
Problem Resolution Rate is a critical metric in assessing how effectively the IT team identifies and resolves underlying problems. A higher rate reduces risks and improves overall system reliability.
DAP Tip: With analytics capabilities, DAPs can quickly identify recurring problems, helping teams to address them efficiently and thus improving the Problem Resolution Rate.
Service Downtime
The total time services are unavailable to users.

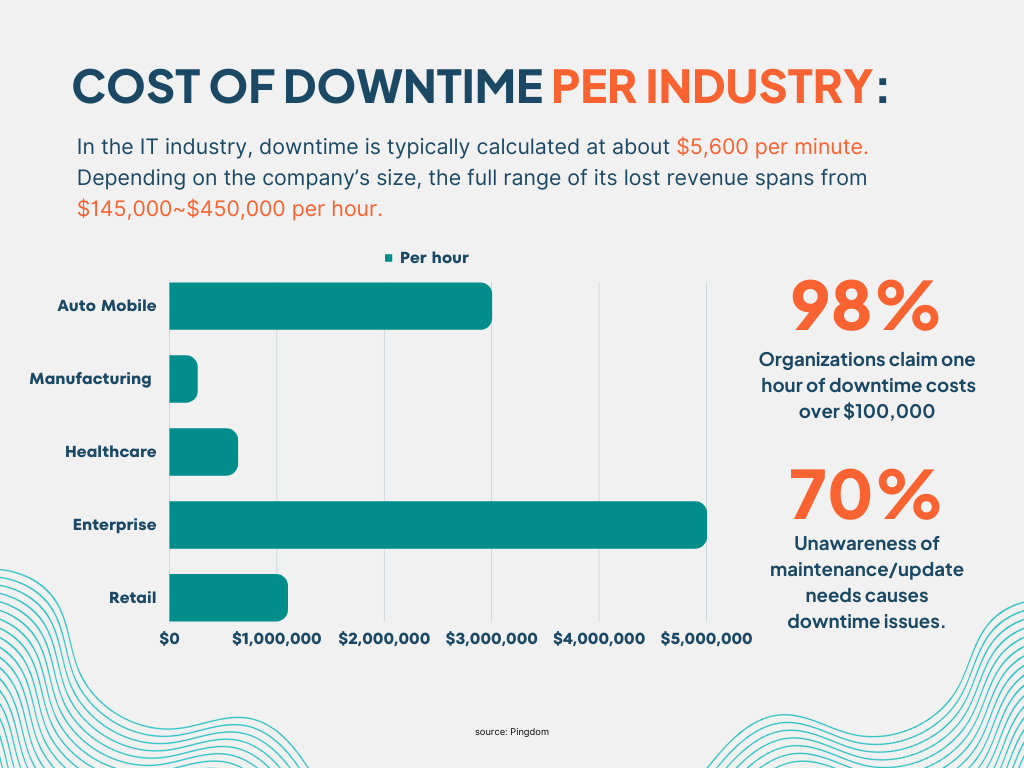
Service Downtime evaluates the impact of outages on business operations. Minimizing downtime is vital for maintaining user productivity and customer satisfaction.
DAP Tip: DAPs offer real-time monitoring and can alert teams to issues quickly, reducing Service Downtime and maintaining service availability.
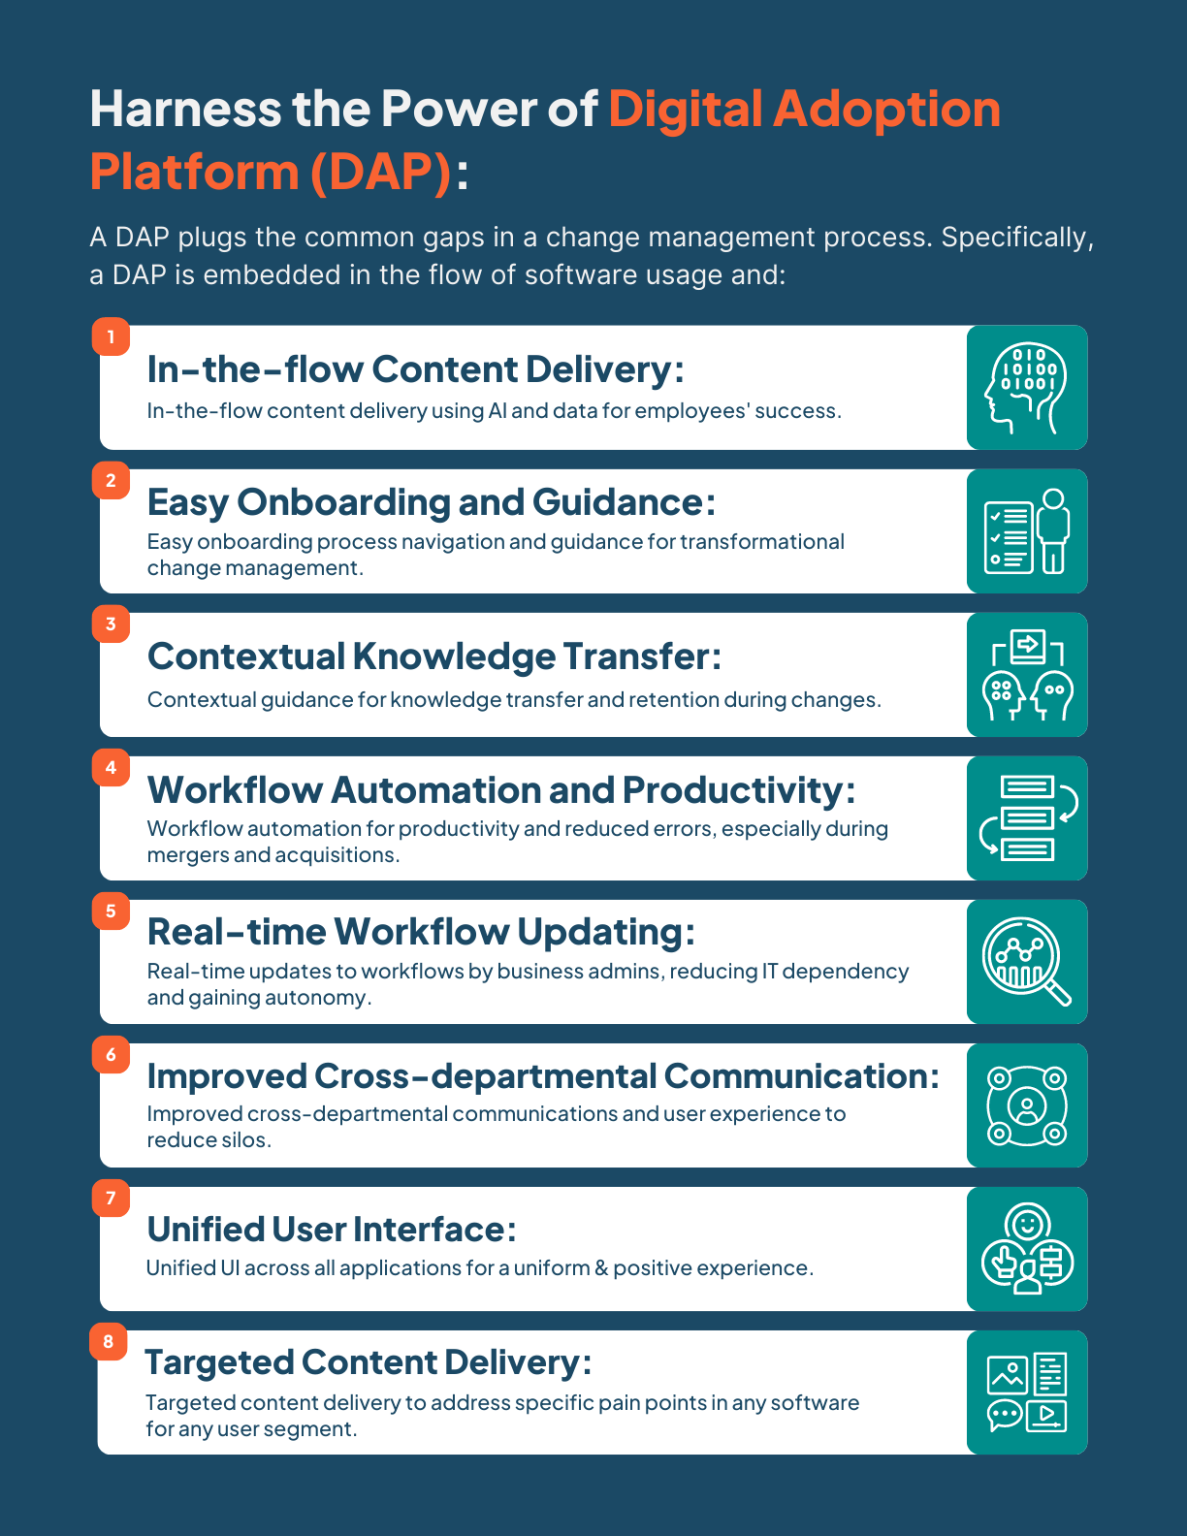
Integrating a Digital Adoption Platform within IT service management can elevate performance across all key metrics. Organizations can substantially improve service efficiency, quality, and alignment with strategic goals by leveraging DAP’s analytics, automation, user engagement, and support capabilities. It’s a robust tool that aligns well with modern IT services’ complex and dynamic nature.
Each ITSM metric plays a unique role in understanding, managing, and optimizing IT services. Together, they provide a holistic view of performance and pave the way for continuous improvement and alignment with organizational goals.
The Role of Digital Adoption Platforms (DAP) in ITSM Metrics
Digital Adoption Platforms (DAPs) are integral to modern IT Service Management (ITSM). They act as a catalyst for enhancing IT services’ efficiency, accuracy, and agility. Here’s a deeper look at how DAPs contribute to ITSM metrics:
Real-time Analytics and Insights
- Data Collection and Integration: DAPs gather data from various sources, allowing for a consolidated view of IT performance across different dimensions.
- Proactive Monitoring: With continuous monitoring capabilities, DAPs can detect issues and trends early, enabling proactive interventions.
- Predictive Analysis: Leveraging machine learning and AI, DAPs can forecast potential problems and suggest preemptive solutions, reducing the risk of major incidents.
- Customized Reporting: DAPs offer customizable reporting, ensuring that relevant KPIs are readily available for different stakeholders, from technicians to executives.
Guided Workflows & Automation
- Process Standardization: DAPs help standardize processes by offering guided workflows, ensuring consistency and adherence to best practices.
- Task Automation: Repetitive and time-consuming tasks can be automated, freeing staff to focus on more complex and value-added activities.
- User Onboarding and Training: DAPs provide in-app guidance and training, enhancing user adoption of new tools or processes, thus shortening learning curves and increasing overall efficiency.

Enhancing Collaboration and Communication
- Cross-Team Collaboration: DAPs facilitate collaboration between different teams, ensuring the right information is available to the right people at the right time.
- Communication with Stakeholders: Through centralized dashboards and notifications, DAPs ensure that relevant stakeholders are informed about service performance, changes, and incidents.
Supporting Decision-making
- Decision Support Tools: DAPs offer visualization and analytics tools that translate complex data into actionable insights, aiding decision-makers in making informed choices.
- Alignment with Business Goals: By providing a clear view of IT performance and its alignment with business objectives, DAPs help in strategic planning and continuous improvement.
Enhancing User Experience
- Personalized User Engagement: DAPs can provide personalized assistance and support, improving user satisfaction and adoption rates.
- Feedback Collection: Gathering user feedback through DAPs helps understand user needs and expectations, leading to continuous improvement in service quality.
Relevant read: ITSM Strategy Needs a Digital Adoption Platform for ServiceNow
Digital Adoption Platforms’ Role in Enhancing IT Service Management Metrics & KPIs
Understanding ITSM Metrics & KPIs is fundamental to achieving a holistic view of IT’s role and impact within an organization. It enables a more nuanced, data-driven approach to decision-making that enhances alignment with business goals, improves efficiency, and fosters customer satisfaction. Coupled with the capabilities of a Digital Adoption Platform, ITSM Metrics & KPIs provide a comprehensive toolset to drive continuous improvement and innovation in service delivery. These insights offer a roadmap for IT leaders to navigate challenges, seize opportunities, and contribute to organizational success.
Seamless and efficient adoption of ITSM tools is more than a desirable asset; it’s a business necessity. This is where Apty, a leading Digital Adoption Platform, significantly impacts.
Apty’s innovative approach to digital adoption goes beyond conventional training or onboarding methods. It offers a comprehensive suite of features, including in-app guidance, user analytics, automation, and self-service capabilities. These features make adopting and leveraging ITSM tools not just more manageable but also more effective.
By addressing key ITSM metrics & KPIs such as incident resolution time and service availability, Apty minimizes service disruptions, enhancing user productivity and customer satisfaction. It’s context-driven support and self-service capabilities equip users to resolve IT issues efficiently, leading to increased satisfaction and reduced service desk tickets.
Investing in a robust digital adoption platform like Apty ensures you’re not merely investing in a tool but a comprehensive solution. A solution that aids your organization in maximizing the return on your ITSM investment by aligning with business goals, improving efficiency, and elevating the user experience.
With Apty, the transformation in your ITSM journey isn’t just about change; it’s about growth and achieving excellence. Leap with Apty and experience a new dimension of effectiveness in your IT service management, one that aligns technology, people, and processes in harmony with your organizational objectives.
Table of Contents
- Top 12 ITSM Metrics & KPIs: The Pillars of Successful IT Service Management
- What Are ITSM Metrics & KPIs?
- Why Are They Important?
- Key ITSM Metrics & KPIs
- First Call Resolution (FCR)
- Mean Time to Repair (MTTR)
- Customer Satisfaction (CSAT)
- Incident Volume
- Service Request Volume
- Availability
- Service Level Agreement (SLA) Adherence
- Change the Success Rate
- IT Cost per User
- Change Lead Time
- Problem Resolution Rate
- Service Downtime
- The Role of Digital Adoption Platforms (DAP) in ITSM Metrics
- Real-time Analytics and Insights
- Guided Workflows & Automation
- Enhancing Collaboration and Communication
- Supporting Decision-making
- Enhancing User Experience
- Digital Adoption Platforms’ Role in Enhancing IT Service Management Metrics & KPIs
- Streamline Your SCM Processes With Apty
- Oracle HCM Implementation: Steps & Best Practices 2025
- ERP Implementation: Steps, Challenges & Best Practices
- 9 Change Management Strategies for Smooth Transitions


